1. WORKING WITH DRAWINGS AND ILLUSTRATIONS IN VIGO6

SIMPLE DRAWINGS AND ILLUSTRATIONS

First thing to be aware of when you start to create custom illustrations for your program is, to understand how the drawings is created and implemented in VIGO6 and in the COPP code.

All drawings are created in the “paint method” of a view. When creating general drawings you use Basic_view and create a “new type” based on that specific view. If you instead need a type dedicated drawing, then you would create a “new type based on” view to that specific control component.

Here is some further explanation on the two types of drawings:   

Type dedicated drawing:

A drawing created to a specific control component. This could for example be if you had a specific valve component and the view was only supposed to be used to show that valve. In this way you need the control component to be able to get the type dedicated drawing in your project.

Before you start making drawing code you have to learn how we write our code.

General drawing:

A general drawing is a drawing that you can use on any view list in any project. Therefore, you need to be aware when making these drawing, that they will be accessible to everybody when you publish it to the server.  

PEN

You use the Pen to setup everything, which refers to pen. In VIGO6 you use the pen to change the properties for how you should draw the lines. We have listed and explained all the different properties below: 

• Pen.Color:=<!Red:= 0, Green:= 0, Blue:= 0!>
• Pen.Join:=Miter
• Pen.Ending:=Flat
• Pen.Width:=2[mm]

PEN COLOR

You use Pen color to decide which color you want the pen to be. You can either choose the color directly by using the RGB utility. If you instead would like to use some predefined colors, VIGO6 also provides you with a kit for that.

This could both be “Pen.Color:=Named_colors[?]” or “Pen.Color:=Palette[?]”.

“Named_colors” is decided by the color theme that you use on your project, and can therefore be different from project to project.

“Palette” is a predefined color palette, which provides a wide choice of different colors and is consistent from project to project.

Color Palette

PEN JOIN

You use Pen Join to decide how the lines joins when drawing more than one line; also known as a "path". In this example, you have a chance to see what the three “joins” look like.

• Miter: Is a sharp normal join.
• Round: Is a round join.
• Bevel: Is a flat corner join.

PEN ENDING

You use Pen ending to used decide how the lines end if the path is incomplete. In this example, you are also provided with a drawing which illustrates the different endings.

• Flat: Is a flat ending
• Round: Is a round ending
• Square: Is an ending with a square in the end.

Last but not least is “pen width” which is pretty self-explanatory, though not insignificant. You use the pen width to decide the width of the line. You need to decide the unit of the width as well.

Lines and paths

Lines are essential when you draw in VIGO6. Without using lines, you are very limited in your drawing options. When drawing lines you also often use paths, because it simplifies things, both visually and in coding.

Paths:
To begin a path you use “Begin_path()”, to end a path you use “End_path(Style:= ?)”.

When ending a path you have different options. You need to use one of the different styles, which we mention and explain below.

Lines and paths

Stroke:
Draws stroke with current pen.

Fill:
Fills the path with current brush.
Fill rule is non-zero/winding.

Stroke_and_fill:
Fills the path with current brush and draws the stroke.
Fill rule is non-zero/winding

Fill_even_odd:
Fills the path with current brush.
Fill rule is Even/Odd.

Stroke_and_fill_even_odd:
Fills the path with current brush and draws the outline with current Pen.
Fill rule is Even/Odd.

Besides these style endings, you also have a “close_path()” ending.
This ending, as the name refers to, closes the path without doing any further. This is very helpful in many ways. If you for example have a path consistent of 3 lines and need to end the path. Here you can just use the close_path() and the line will automatically find your first “x,y coordinate" and close the path.

You can also combine the two “endings”, and first close the path to return the line to starting point and then end the path with a style.

Lines:
Before you draw lines, you need to know where we want to start our new lines.
Therefore you use a method “Move_to(X:= ? [mm], Y:= ? [mm])”, which changes the starting “x,y” position.

After doing this, you are ready to start drawing lines. You draw lines by using the following method “Line_to (X:= ?[mm], Y:= ?[mm])”.

Example:

 You can use “Display” before you use the code to avoid complications in local names and the displays names.
If you for example have a local variable called Line_to as well, then you have a problem. In that case, the editor will automatically assume that you want to use your own Line_to and put “Comp.” before the line_to like with the display.   

Example:

Drawing Examples

Now that we have covered the most commonly used drawing code, let’s try a drawing example.
In the following examples, you’ll be creating a rectangle in 2 different ways. First method is to show how you’ll use lines and paths to create the Rectangle. Second method is to show the simple way.
The result will be identical for both methods.

 First method/hard method:

To use this method you’ll need to combine all the knowledge you just got by reading this tutorial.

• First thing you need to do is to setup your view_region. This is the first thing you do every time you have a view of anything in VIGO6.
Type ConstantsView_Region → BottomRight/TopLeft → X/Y

• Now you can start to make our drawing code. First thing in the code is to setup our Pen and Brush.

  • Next is to make the drawing itself. Here you need to use both paths and lines.
  • Now you finished drawing our rectangle. Following is the result:

Second method/Easy method:   

For this method you will need to use one of VIGO6’s built in methods. Specifically, the method called “Rectangle”.

• First thing you need to do here is also to setup your view_region. This is the first thing you do every time you have a view of anything in VIGO6 as mentioned before.

Type ConstantsView_Region → BottomRight/TopLeft → X/Y

• When you have set up our view_region, then you are ready to make your code.

  • Now you are finished with making our drawing code for the second rectangle. Following is the end result:

You should now be prepared to make your own simple drawings. We will explain how to make more advanced drawings in another tutorial.

ADVANCED DRAWINGS AND ILLUSTRATIONS

For more advanced drawings and illustrations, we have a little more user friendly method of implementing these drawings in VIGO6.
Instead of drawing every line manually, we have an external program to do this, which is included when buying VIGO6

We have named the program "SVG to COPP converter" and we use it to convert SVG vector graphic to COPP code. This is very helpful, so we don’t have to draw our more advanced illustrations manually, like we just did in the example above.  

We advise you to use either Illustrator or the free alternative Inkscape which we know is supported by our converter. Below is some information, which you need when you save the svg files to insure a usable result in VIGO6

ADOBE Illustrator

When using Adobe Illustrator be sure that you are saving as SVG and not exporting as SVG.

You also have to make sure that you use the "SVG Tiny 1.1" SVG profile when saving your svg file.

To make sure that the drawing is located at right position on the window in the converter, make sure to uncheck the "Responsive" checkbox in the save window.  

In the following, we have made a recap of the most important things to be aware of when using Illustrator to make your drawings/illustrations. 

• Save as SVG 
• Use "SVG Tiny 1.1" SVG Profile when you save
• Uncheck "Responsive" in more options of the SVG save window 

SEE HOW IT WORKS

Play Video

Inkscape

When using Inkscape there is two thing to be aware of.

The first thing is before you even start using the program to draw.
You need to make sure that you have chosen the right settings in inkscape:

Shift+Ctrl+D is the shortcut for opening the Document Properties.

In this properties panel you need to make sure that both your "Display Units" and our "Units" are set to pixels (px).

Another important thing is that you set your "Scale x:" to 1. Normally it’s set to 0.265, which would make the source into mm instead of pixels. 

When you made sure that your settings look like the picture on the right, you are ready to start drawing in Inkscape.

When you are finished and want to save the drawing you just made, follow the step below: 

Only thing to be aware of when saving is that you save as "Plain SVG" and not "Inkscape SVG". Only "Plain SVG" will work in the converter.

SEE HOW IT WORKS

Play Video

Using the converter

Below is an explanation with illustrations on how to use the converter itself.

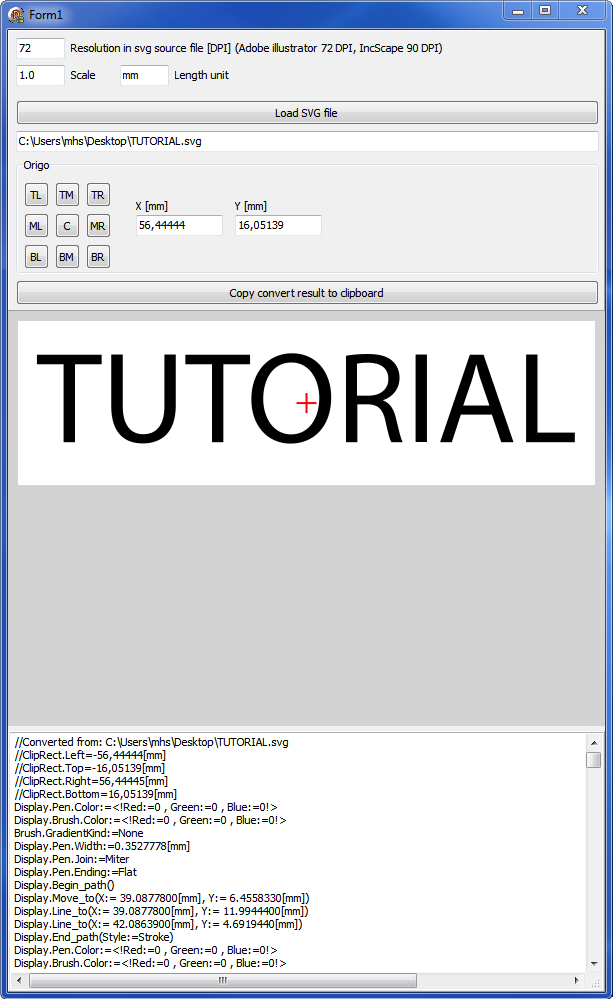
To the right is an illustration which shows the "SVG to COPP converter".

The converter is easy to use, and you will be able to have your drawing/illustration in VIGO6 in a couple of minutes, if you have followed the instructions above.

Instructions for using the converter
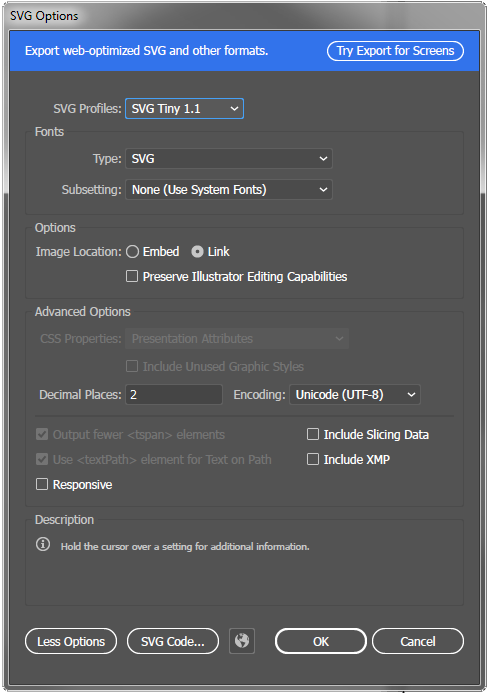
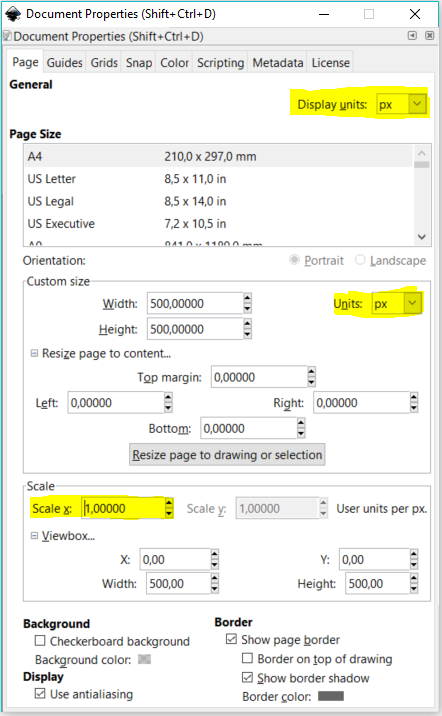
Resolution
Resolution is the first thing to choose when you import a SVG file to the converter. The converter tells you which DPI is used in both Inkscape and Illustrator. Therefore, we advise you to choose according to which program you use. Otherwise, size in accordance with original file will be different.

Scale
Next is to choose if you want a different scale than the input SVG file provide. Choose, as you like.

Default length
Default lenght unit is default [mm], and you can change it to your liking, according to the quantity you choose in VIGO6.

Import
To import the SVG file itself press the big "Load SVG file" button and use the windows window to navigate to the fill and press open.

When you import a SVG file to the converter, you get the chance to choose where you want the "Origo" to be. In other words, where you want the drawing/illustration to align. You have 9 different align options. The red "crosshair" show the align position you have selected.

To the right of "Origo" you will be getting up to date x,y length information in wanted length unit. In effect, when you update scale, then x,y length is updated as well. In this example we have showed it in [mm].

Copy and paste
Under "Origo" there is one more big button. You can use the button to copy the result to your clipboard. Afterwards, you can paste the result into VIGO6 and view it.

Preview
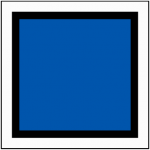
In the middle of the converter window, you will be provided with a "preview" of how the end result will look in VIGO6.

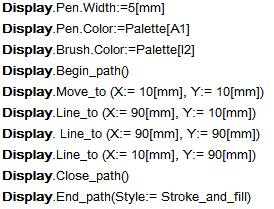
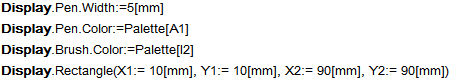
Last, at the bottom is the COPP code displayed, which is the result that you have copied to the clipboard with the button above.

SEE HOW IT WORKS

Play Video